The Application Domain
This page gives a description of the application domain that SageCite has investigated.
by Monica Duke
About Sage Bionetworks
Sage Bionetworks is a nonprofit biomedical research organization created to revolutionize how researchers approach the complexity of human biological information and the treatment of disease. The core business of Sage Bionetworks is to develop molecular maps of human disease through community-based modelling of large multi-contributor datasets [1]. This is in response to the perception that health care has not benefitted from the revolution that was expected from sequencing the human genome, particularly in the area of drug development, where lack of efficiency of drugs in phase II trials prevents them from becoming drugs approved for use in humans. Sage Bionetworks sees an opportunity to develop models that act as maps, describing the underpinnings of disease and predicting the behaviour of complex systems. This modelling of disease requires large-scale data and data-intensive science. Different but complementary modelling approaches are needed, as well as integrative methods that combine multiple traits and outcomes. The maps or networks are “a convenient way to represent complex molecular interactions and to provide a framework for predicting causal relationships between molecular entities and clinical outcomes.”
Stephen Friend, President, Co-Founder and Director of Sage Bionetworks, explains his vision in this TEDx talk, describing how molecular mechanisms could drive a revolutionary change in medicine, particularly in personalised medicine, and the challenge of socio-cultural change that is needed particularly with regard to reward structures.[2]:
This challenge in considering molecular biology and building maps of complex systems is also described less formally in [3], which also provides more background on how Sage Bionetworks came into being.

The Sage Commons
Sage Bionetworks is pioneering a “Commons” where scientists can collaborate to build better maps of disease using clinical and genomic data, and applying tools to build the models. The commons is underpinned by the sharing of open data which is curated and documented (including methods, tools and workflows) so that the data is available and accessible for re-use to be built on by others.
The Sage Bionetworks Platform for building the Sage Commons
Sage Bionetworks announced the release of its platform at the Sage Congress in April 2011. The platform is described in [1]. Data is stored in a repository in the form of ‘curated’ data, which in this context means data that the data has undergone integrity checks and transformation of the dataset into a standard format. One aim is to make available data that is ‘analysis-ready’ and that is most suited to model-building, which requires both genomic and phenotypic data, which may have been obtained from different sources. The picture that emerges is one in which data from multiple sources of is combined and multiple contributors with different roles are involved in a process made up of a sequence of stages.
Stages of a workflow at Sage Bionetworks
Although all project at Sage Bionetworks vary in unique ways, and idealised version of a typical predictive genetics project can be described [4]. A combination of phenotypic, genotypic and expression data are acquired and formed into a ‘globally coherent dataset’. This dataset consists of:
- Phenotypic data (this includes different treatments received, biometric traits e.g. height, gender, measures of clinical outcome e.g. survival)
- Genomic data (commonly SNP data but also partial or complete genome sequences)
- Expression data (gene expression, protein expression, microarray data)
- Mapping of the data to associate it uniquely to a subject
Sources of data, stages and contributors involved in the Sage Bionetworks Digital Commons Slide by Lara Mangravite of Sage Bionetworks
The following steps are then followed, each of which are likely to be performed by a different scientist who specializes in that area. One scientist acts as the project lead.
Stage 1: Data Curation – consists of basic data validation to ensure integrity and completeness of the data (although some file use common formats, others have considerable variety.) The datasets include microarray data and clinical data. This step ensures that the format of the data is understood and the required metadata is present.
Stage 2: Statistical QC – Actual values in data are validated for quality to check for experimental artifacts. The checks made are dependent on the type of data set and involves the use of R scripts or tools like plink. The output is a normalised dataset.
Stage 3: Genomic Analysis – involves identifying regions in the genome associated with clinical phenotypes and other molecular traits. The Sage Genetic Analysis Pipeline which consists of a set of R and C programs is used. Statistical analysis is applied to identify interesting loci significantly associated with with specific phenotypes e.g. clinical phenotypes (cQTL)
Stage 4: Network Construction Involves building a network using a statistical technique to capture how biological entities, e.g. genes, are related to each other. Networks can contain up to 100K nodes. In the network, nodes represent biological entities of some type (gene, protein or even physiological trait) and edges represent relationships between pairs of nodes. The output could be a correlation network (undirected graph) or Bayesian Network (directed, acyclic graph).
Stage 5: Network Analysis Involves examining the network to determine how its function can be modulated by a specific subset of biological nodes. The output may be a list of genes or a subnetwork. The networks from the previous steps are analysed using techniques like Key Driver Analysis to determine a subset of interest.
Stage 6: Data Mining A report validating claims from network analysis is produced by a domain specialist with knowledge of the study domain. This stage uses resources from the literature and public databases to assess the predictions. This information is used to annotate network models to build the case for the involvement of genes in the functioning of the network.
Stage 7: Experiment Validation Laboratory experiments are devised and performed to test the claims of the model. Validation is not carried out at Sage Bionetworks but is completed in partnership with Sage Bionetworks collaborators.
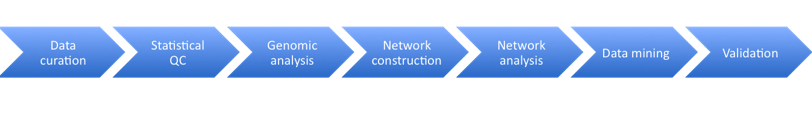
Stages in the Sage Bionetworks workflow
Although the stages are presented as a linear process, several iterations may take place, with the scientists going back to previous processes to reasses or repeat previous stages to answer questions on the models as they arise.
[1] Derry J et. al Developing predictive Molecular Maps of Human Disease through Community-based Modeling. http://precedings.nature.com/documents/5883/version/1/files/npre20115883-1.pdf
[2] Stephen Friend True Crowd Sourcing of Medicine: Activating All of Us Tedx talk. http://youtu.be/ykoC_zvbXWg
Acknowledgements: A summary of the 7 Stages was produced by Peter Li; Mike Kellen shared an internal document he had written describing a typical Sage Bionetworks project. Individual slides – Sage Bionetworks scientists as shown in each slide.
Trackbacks and Pingbacks